

In the world of delivering complex software development projects, the work can often be unpredictable in its nature. Agile frameworks, particularly Scrum, aim to provide organisations with self-organising, autonomous, and empowered teams to create products and solutions that deliver value for the business and its customers as predictably as possible. Yet there is always a general reticence for teams to commit to feature delivery dates for fear of disappointing stakeholders.
Challenges in Agile Planning and Stakeholder Expectations
This is especially true in the land of software development, which is filled with unknowns. Although the scrum guide provides us with a framework for planning and forecasting work, this is only on a sprint-by-sprint basis, with only the next sprint being known to the team as it’s planned at the Sprint Planning event. Yet key stakeholders and product owners alike often always have the same questions: ‘When will the feature be done?’ or ‘When will my users see ALL of the value for this feature delivered into production?’. Pressures to answer these questions are often driven by those in control of the budget, and Agile Leaders, who are not always close to the details, are ultimately tasked with providing the answer. If you are an Agile leader being asked this question by your stakeholders, this is the article for you. It outlines the tools and metrics you can use to answer these questions with a high degree of confidence and ultimately improve a team’s future feature delivery predictability.
What is Agile Working?
Agile working is a transformational approach to how and where work is done. It empowers individuals and teams to perform tasks in the most effective ways—regardless of time, place, or traditional structure. It’s all about flexibility, autonomy, and results.
Learn More About Agile WorkingThe Importance of Accurate Measurement in Agile Teams
Firstly, teams need to make sure they are measuring the right things; both to help drive them to become more predictable but also to help us forecast delivery. With a plethora of metrics available to us ‘out of the box’ in both Jira and Azure DevOps, it can be hard to know which ones we should focus on. The ‘go to’ for most Agile leaders is to simply use historic Story Point velocity and attempt to use this to forecast a delivery date. This can be inherently inaccurate as not only do we introduce even more variation that is baked into the story estimation process, but usually only provide one date to stakeholders. Often, this results in providing an inaccurate feature delivery commitment date to which teams are held to account by the product owner. Often, it is user value that is offered up as the sacrifice to ensure that the team meets the feature delivery date that the Product Owner has communicated to business stakeholders.
Key Metrics for Improving Forecast Accuracy
To help us further improve the accuracy of forecasted feature delivery dates, we need to unpick the questions of ‘When will it be done?’ or ‘When will I get Value?’ to ensure teams are focusing on the correct metrics. We are essentially being asked by the stakeholders what the end-to-end elapsed feature delivery time frame looks like. To determine this, we have three very useful metrics that teams can focus on:
- Lead time is the time between a request being made and a story being released. It’s the total time the stakeholder is waiting for a work item to be delivered.
- Cycle time is calculating the actual work-in-progress time. It tracks how long a task stays in the different process stages. Keeping track of your cycle times enables you to measure and get an insight into the team’s process to complete work.
- Throughput: The number of items that have completed the end-to-end development process.
Although usually associated with KANBAN, lead time, cycle time, and throughput are very useful for scrum teams, too, and should be at the vanguard of team process improvement discussions.
Driving Team Improvements Through Metrics
Secondly, we need to help teams drive improvements through these metrics. This can be done by using them to facilitate data-driven discussions at retrospectives dri, make even more improvements to the teams’ processes, and ultimately deliver value more predictably. This is achieved by teams focusing on Lead time and cycle time at retrospectives. The focus of team discussions here should be on how they can address the root cause of variation they see in these metrics. By continually inspecting and adapting, teams can reduce variation in both lead and cycle times significantly and, therefore, become much more predictable in terms of delivering value to users into production. This can be done successfully with teams by using the control chart in Jira and focusing the discussion with the team on any outliers they see in the data set. Improved throughput, therefore, can be seen as the ‘output’ of focusing on the removal of root cause variation on lead and cycle times. This then becomes our most useful metric to forecast future delivery and ultimately help us answer the question ‘When will it be done?’ or ‘When will I get Value?’.

Monte Carlo Simulation for Agile Forecasting
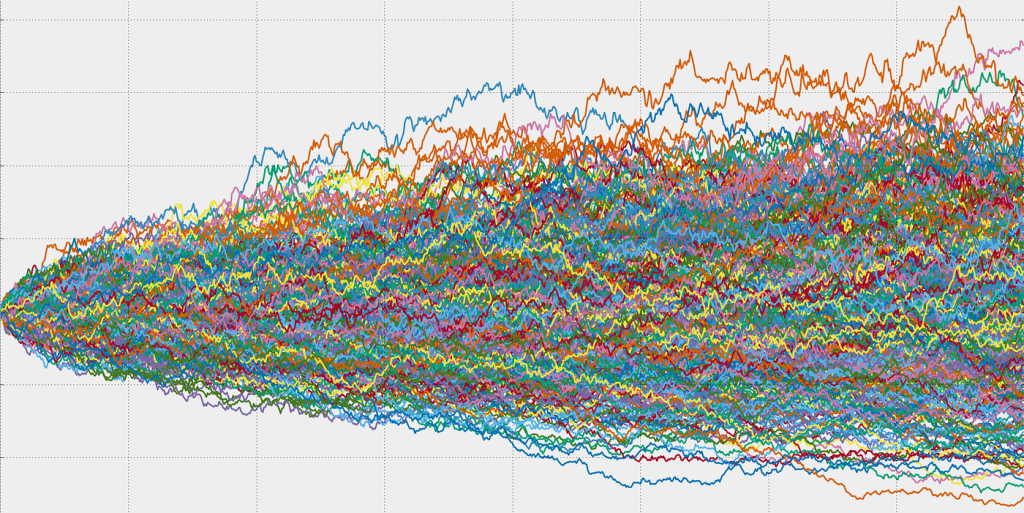
Finally, by using past throughput data, we can leverage a Monte Carlo Simulation, otherwise known as the Monte Carlo Method, to generate a probabilistically forecast of how long it will take to complete a feature based on the number of stories we have to execute. Simply put, the Monte Carlo Simulation is a mathematical technique which is used to estimate the possible outcomes of an uncertain event. It was invented by John von Neumann and Stanislaw Ulam during World War II while working on nuclear weapons projects at the Los Alamos National Laboratory. Since its invention, it has been put to work to help predict a host of events with uncertain outcomes, such as artificial intelligence and the stock market. But it also holds great power for Agile leaders to answer the dreaded questions ‘When will it be done?’ or ‘When will I get Value?’. The simulation works by building a model of possible results by leveraging a probability distribution, such as a uniform or normal distribution, for any variable that has inherent uncertainty. It then recalculates the results over and over, each time using a different set of random numbers between the minimum and maximum values, and generates a percentage likelihood.
The best way to start using a Monte Carlo Simulation built specifically for predicting a team’s feature delivery date is to head over to Focused Objective and download the ‘Throughput Forecaster: I want to forecast how long a single feature may take’ spreadsheet. Add in your team’s throughput, then the spreadsheet hypothetically completes all work 500 times. It calculates the likelihood result as the number of simulated trials that finished on or before a given date and outputs a percentage likelihood of a team hitting a certain date. Why is this better than burndowns and traditional Agile forecasting? Most forecasting techniques give a single date result and hide the likelihood of that date (This is what happens when we use Story Point velocity to forecast a date). Most often, the date given as a result is 50% because work is divided by an average (average points delivered per sprint). That’s the odds of a coin-toss. By utilising the Monte Carlo Simulation Agile leaders can provide feature delivery commitment dates with up to 95% confidence rating to stakeholders.
Conclusion: Improving Forecast Accuracy Over Time
By leveraging the Monte Carlo Simulation, Agile leaders can communicate feature delivery dates to stakeholders with a much higher level of confidence that scrum teams will deliver to the date. Furthermore, if teams also focus on iteratively improving both lead time and cycle time by addressing the root cause of variation they see within these metrics, then forecasts will only become more accurate over time.
Measuring the Right Metrics
Firstly, teams need to make sure they are measuring the right things, both to help drive them to become more predictable but also to help forecast delivery. With a plethora of metrics available ‘out of the box’ in both Jira and Azure DevOps, it can be hard to know which ones we should focus on. The ‘go-to’ for most Agile leaders is to simply use historic Story Point velocity and attempt to use this to forecast a delivery date. This can be inherently inaccurate, as not only do we introduce even more variation that is baked into the story estimation process, but we usually only provide one date to stakeholders. Often, this results in providing an inaccurate feature delivery commitment date to which teams are held to account by the product owner. Often, it is the user value that is offered up as the sacrifice to ensure that the team meets the feature delivery date that the Product Owner has communicated to business stakeholders.
Improving Forecast Accuracy
To help further improve the accuracy of forecasted feature delivery dates, we need to unpick the questions of ‘When will it be done?’ or ‘When will I get Value?’ to ensure teams are focusing on the correct metrics. We are essentially being asked by the stakeholders what the end-to-end elapsed feature delivery timeframe looks like. To determine this, we have three very useful metrics that teams can focus on:
- Lead time is the time between a request being made and a story being released. It’s the total time the stakeholder is waiting for a work item to be delivered.
- Cycle time Cycle time measures the real-time duration a task takes from start to finish, monitoring the time spent in each stage of the process. By recording and analyzing these cycle times, you gain valuable insights into the productivity of your team’s workflow and identify areas for process improvement.
- Throughput is the number of items that have completed the end-to-end development process.
Although usually associated with KANBAN, lead time, cycle time, and throughput are very useful for Scrum teams, too, and should be at the vanguard of team process improvement discussions.
Utilizing Data-Driven Discussions
Secondly, we need to help teams drive improvements through these metrics. This can be done by using them to facilitate data-driven discussions at retrospectives to drive even more improvements to the teams’ processes and ultimately deliver value more predictably. This is achieved by teams focusing on Lead time and cycle time at retrospectives. The focus of team discussions here should be around how they can address the root cause of variation they see in these metrics. By continually inspecting and adapting, teams can reduce variation in both lead and cycle times significantly and therefore, become much more predictable in terms of delivering value to users into production. This can be done successfully with teams by using the control chart in Jira and focusing the discussion with the team on any outliers they see in the data set. Improved throughput, therefore, can be seen as the ‘output’ of focusing on the removal of root cause variation on lead and cycle times. This then becomes our most useful metric to forecast future delivery and ultimately help us answer the question ‘When will it be done?’ or ‘When will I get Value?’
Leveraging the Monte Carlo Simulation
Finally, by using past throughput data, we can leverage a Monte Carlo Simulation, otherwise known as the Monte Carlo Method, to generate a probabilistic forecast of how long it will take to complete a feature based on the number of stories we have to execute.
I am a proactive, enthusiastic, highly motivated and experienced Scrum Master / Agile Coach. My exceptional interpersonal skills, and my ability to understand and succinctly present complex issues, enables me to communicate and influence effectively at all levels of any organisation in the adoption of Scrum as a delivery framework. My Systems Thinking approach to problem solving has enabled me to identify areas for improvement, streamline existing cross functional deployment processes helping the Scrum Team to deliver product to market quicker and to higher quality.